Summary
Market Dynamics for Flexible Space
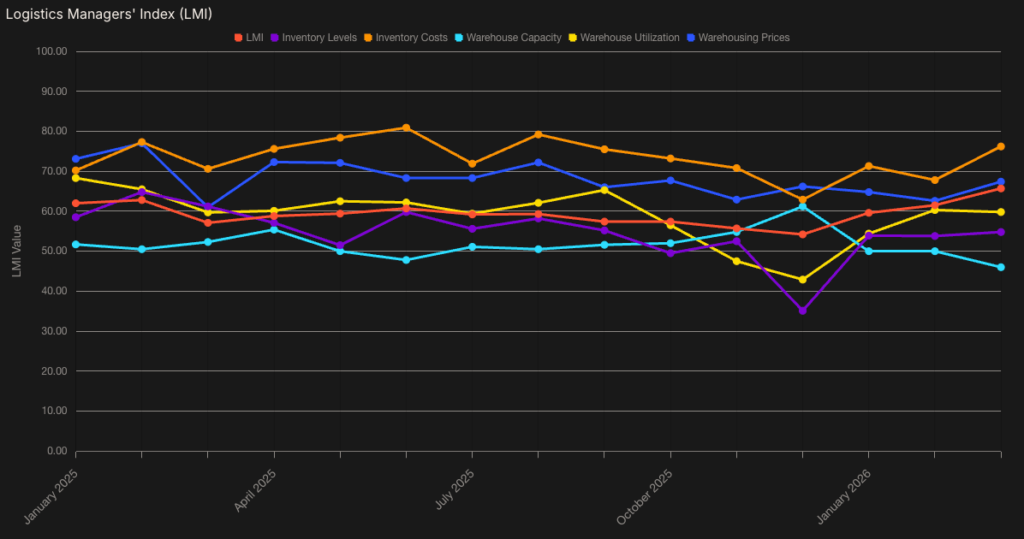
- In March 2026, the logistics industry entered a “perfect storm” as the Logistics Managers’ Index (LMI) surged to 65.7. This expansion was driven by a record 12.7-point jump in Transportation Prices (89.4) against a contracting capacity reading of 39.2, the sharpest inversion since the COVID-19 pandemic. This volatility is rooted in the closure of the Strait of Hormuz, which has sidelined roughly 20% of global oil supplies and sent diesel costs climbing by 30%.
- These operational strains mirror broader economic alarms, as the IMF recently downgraded its 2026 global GDP forecast to 3.1%, with warnings of a potential dip to 2% if energy disruptions persist. For logistics professionals, these macroeconomic shifts translate into immediate tactical pressures, where rising fuel surcharges and compressed margins have made cost-mitigation and network flexibility non-negotiable strategic priorities.
Rising Transportation Prices(3)
LMI and Fuel Cost Pressures
The logistics landscape shifted significantly in Q1 2026. According to the March Logistics Managers’ Index (LMI), transportation prices climbed 12.7 points to a reading of 89.4, a surge fueled by extreme capacity tightening and geopolitical volatility. As crude oil topped $100 per barrel, national diesel averages followed suit, reaching $5.67 per gallon by early April, with West Coast records exceeding $7.00. This marks the fourth consecutive month of contraction for transportation capacity, which dropped to 39.2, the tightest reading since the pandemic-era freight boom. With 12-month forecasts predicting growth in transportation prices to an LMI record of 93.0 and further capacity shrinkage, the “wait-and-see” approach is no longer viable. In this environment, supply chain transparency and route optimization have shifted from operational goals to strategic necessities for offsetting compounding costs.
Shifting Tariff Landscape Demands Supply Chain Agility(4)
Policy, Refunds, and Network Design
The U.S. trade environment shifted significantly following the Supreme Court’s February 2026 ruling, which invalidated broad tariffs previously imposed under the International Emergency Economic Powers Act (IEEPA). While this creates a complex $175 billion refund process for many shippers, the administration’s immediate pivot to Section 122 duties and new Section 301 investigations suggests that tariff volatility will remain a consistent factor in 2026 logistics. In response to these fluctuations, many organizations are moving away from the structural rigidity of traditional networks in favor of a dual-track strategy that balances short-term agility with long-term resilience. By utilizing agile short-term capacity, shippers can execute strategic inventory pull-forwards to hedge against sudden duty hikes without the constraints of fixed-asset commitments. Concurrently, there is an increasing focus on building “pivot-ready” networks through the integration of flexible nodes ensuring the supply chain can evolve as quickly as the regulatory landscape.
2026 Q1 Regional Market Highlights(5)
Regional Warehousing Detail
Lehigh Valley, PA: Vacancy surged by 1.56 percentage points QoQ and 2.46 percentage points YoY, marking one of the sharpest supply-driven shifts in the country. Asking rents grew moderately at 0.85% QoQ and 3.39% YoY, while sublease availability skyrocketed by 285% YoY as the market struggled to absorb a massive wave of completions.
Atlanta, GA: The market showed signs of stabilization with vacancy declining 0.18 percentage points QoQ, though it remains up 0.75 percentage points YoY. Rents rose slightly by 0.30% QoQ and 2.69% YoY, while sublease inventory successfully contracted by 3.2% YoY.
Charlotte, NC: Vacancy edged up 0.12 percentage points QoQ and 0.98 percentage points YoY, ending the year in double digits at 10.0%. While rents grew 4.87% YoY, they experienced a 0.90% decline QoQ, reflecting a softening in landlord pricing power.
Dallas, TX: Dallas-Fort Worth demonstrated resilience with vacancy decreasing 0.10 percentage points QoQ and 0.57 percentage points YoY. Asking rents continued their upward trajectory, rising 0.99% QoQ and 5.04% YoY, despite a 5.8% increase in sublease space YoY.
Denver, CO: Vacancy increased by 0.15 percentage points QoQ and 0.70 percentage points YoY. Market pricing faced significant pressure, with rents dropping 1.35% QoQ and 1.77% YoY, compounded by a 46.4% surge in sublease availability YoY.
Houston, TX: Vacancy remained largely flat with a 0.06 percentage point increase QoQ but rose 0.85 percentage points YoY. Rents saw robust growth of 0.74% QoQ and 5.31% YoY, even as sublease activity climbed 43.5% YoY.
Indianapolis, IN: Indianapolis saw a notable recovery as vacancy fell 0.96 percentage points QoQ and 1.37 percentage points YoY. Asking rents remained essentially flat with 0.13% QoQ and 0.52% YoY growth, supported by a 10.3% reduction in sublease space YoY.
Inland Empire, CA: Vacancy stayed nearly stagnant with a 0.02 percentage point increase QoQ but is up 1.29 percentage points YoY. Rents faced headwinds, falling 0.73% QoQ and 3.47% YoY, as the region adjusted to the influx of 2019-start deliveries.
Kansas City, MO: Vacancy rose 0.18 percentage points QoQ and 0.70 percentage points YoY. Rents increased by 0.28% QoQ and 1.11% YoY, while the market successfully shed 27.1% of its sublease inventory YoY.
Orlando, FL: Vacancy improved by declining 0.60 percentage points QoQ, though it is up 0.30 percentage points YoY. Rents showed strong momentum, rising 0.48% QoQ and 5.07% YoY, with sublease SF remaining flat (+0.37% YoY).
Phoenix, AZ: Vacancy remained stable with a negligible 0.05 percentage point increase QoQ and a 0.05 percentage point decrease YoY. Rents grew steadily by 0.55% QoQ and 3.46% YoY, despite a 15.3% increase in sublease activity YoY.
Reno, NV: Vacancy spiked by 1.32 percentage points QoQ but ended the year only 0.14 percentage points higher YoY. Rents declined by 1.10% QoQ and 0.33% YoY, though the market saw a significant 52.6% drop in sublease SF YoY as secondary space was pulled or absorbed.
Seattle, WA: Vacancy increased by 0.38 percentage points QoQ and 1.64 percentage points YoY. Rents maintained positive momentum, growing 0.62% QoQ and 0.89% YoY, while sublease availability rose modestly by 4.6% YoY.
Toronto, CAN: The market saw a slight improvement in vacancy, which declined by 0.18 percentage points QoQ, though it remains up 1.05 percentage points YoY from the extremely tight conditions of 2024. Market asking rents remained essentially flat with a marginal increase of 0.07% QoQ and a modest 1.03% growth YoY, reaching $13.73/SF. Sublease activity showed signs of stabilization with a negligible increase of 0.43% QoQ, although total sublease inventory has expanded significantly by 29.8% YoY as the market adjusts to new supply.
(1) CoStar CRE, U.S. Census Bureau (2) The New York Times Company, Logistics Managers’ Index, World Bank Group (3) Logistics Managers’ Index, U.S. Energy Information Administration, AAA Fuel Prices (4) 607 U. S. ____ (2026), Holland & Knight LLP, Reuters (5) CoStar CRE