Summary
Market Dynamics for Flexible Space
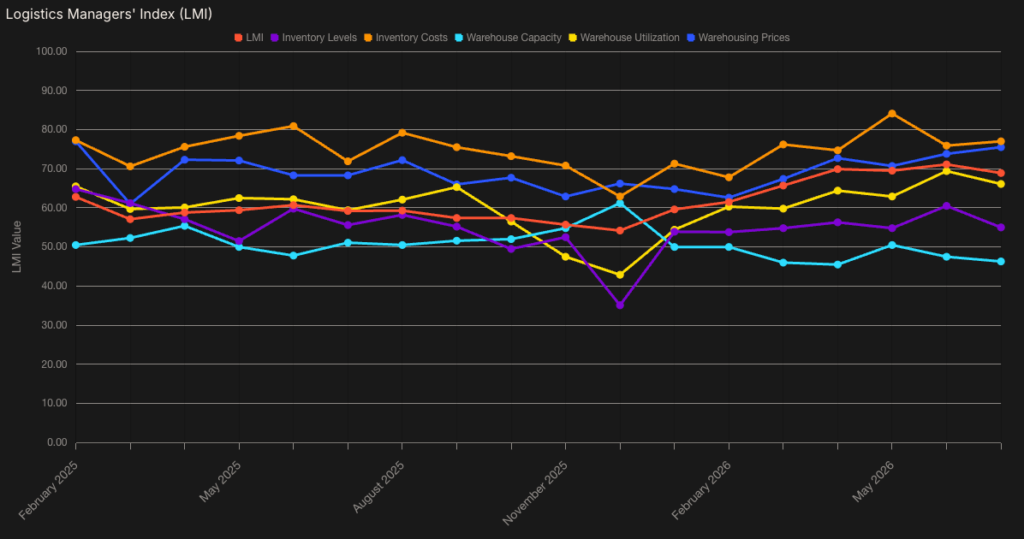
- The freight fever broke. Warehousing caught it. The LMI composite eased from 71.1 to 68.9 in July as transportation price and utilization growth slowed sharply, even as pressure built on the warehousing side.
- Transportation: Price fell 5.5 points to a still-elevated 86.9; utilization dropped 9.7 points to 65.0; capacity tightened to 28.4, its eighth consecutive month in contraction and tied with April for the second-fastest contraction in LMI history.
- Warehousing: price rose 1.7 points to 75.5, the fastest expansion since February 2025; capacity contracted for a second straight month at 46.3; utilization eased from June to a still-elevated 66.1.
- Inventory levels explain the divergence. The Inventory Levels component fell 5.5 points to 55.0, confirming the tariff-driven pull-forward has run its course. The wave of goods that transportation moved in Q2 is now stationary, and warehouses are holding it, likely through the five consecutive months of import declines NRF is projecting. Inbound pressure is easing, but the inventory already in the network is still consuming warehousing capacity.
- For shippers, cost pressures are broadening. Transportation dominated the first half of 2026, but warehousing is emerging as an additional constraint in the second half, with capacity contracting, utilization elevated, and prices accelerating as pulled-forward inventory moves through the supply chain. With peak season still ahead, warehousing conditions are likely to remain tight.
- Bottom line: the challenge is shifting from inventory volume to inventory placement and carrying cost. Slower overall inventory growth is masking a split between upstream expansion and downstream retail contraction, meaning pulled-forward inventory is likely sitting higher up in the network even as warehousing capacity tightens and costs stay elevated.
The Next Inventory Wave Is Moving Inland(3)
Manufacturing, Imports, Warehouse Vacancy
Inventory remains relatively lean even as manufacturing accelerates. The U.S. business inventory-to-sales ratio fell to 1.28 in May from 1.39 a year earlier, while July’s ISM Manufacturing PMI reached 55.6, its strongest reading in more than four years, with production climbing to 58.5, backlogs rising to 55.0, and 15 of 18 manufacturing industries expanded. Most telling: ISM’s Customer Inventories Index fell to 40.7, a reading ISM itself flags as “too low”, suggesting downstream customers may need to restock as factory output grows. The July Logistics Managers’ Index (LMI) shows where that gap is emerging. Retailers’ inventory levels swung month over month from expansion (66.0) to contraction (46.3), while wholesalers held steady at 59.0, suggesting goods pulled forward this spring remain concentrated higher in the supply chain rather than flowing through to retail.
At the same time, the import wave is moving past its peak. NRF’s August Global Port Tracker reports that retailers pulled merchandise forward ahead of tariff changes, making May, not the traditional late-summer or fall peak, the year’s busiest import month. Import volumes are expected to decline from August through November before a modest December uptick. Together, fading import frontloading and stronger domestic production point to the next replenishment wave increasingly originating within the U.S.
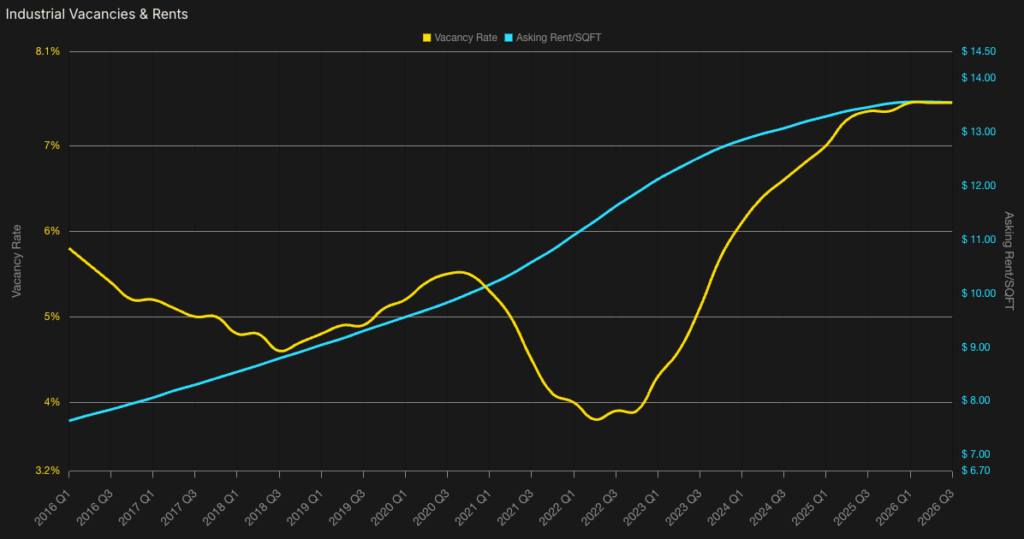
That could change where warehouse pressure shows up next. Several major import gateways still carry above-average vacancy, including Savannah (10.8%) and the Inland Empire (8.9%), compared with 7.5% nationally. Manufacturing-heavy markets like Detroit, Cleveland and Cincinnati by contrast, remain near or below 4%. Manufacturers are also taking a growing share of industrial space, accounting for more than 12% of U.S. leasing activity in the first half of 2026, up from just 7.6% in 2022 Q3. The Flexe Spot Warehousing Index shows the same split: import gateways like Coastal LA, Inland Empire, and Newark are loosening into buyer’s markets, while manufacturing-heavy regions like Indianapolis and Kansas City remain tight seller’s markets. If domestic restocking accelerates, those tighter inland markets have less capacity to absorb incremental demand, even as some major import gateways retain more available space.
Transportation Costs: The Fuel Story Returns(4)
Diesel Costs, Transportation Capacity, and Network Design
In June, transportation pressure looked increasingly like a capacity story rather than a fuel story. July brought fuel back into the picture without easing the capacity constraint. U.S. diesel prices fell for nine consecutive weeks, reaching $4.58 per gallon on July 6, before reversing sharply and climbing to $5.35 by August 3. The reversal came as Russia halted diesel exports and renewed U.S.-Iran hostilities raised fresh concerns about petroleum flows through the Strait of Hormuz, adding pressure to an already tight global diesel market.
Capacity remains the other half of the equation. July’s Logistics Managers’ Index showed Transportation Capacity contracting for an eighth straight month in July, falling to 28.4, even as utilization retreated to 65.0 from June’s eight-year high. Prices at 86.9 remain extreme by any historical standard.
For shippers, transportation costs now have two active pressure points: fuel and capacity. Neither is easily controlled, but network design is. As freight, rent, and labor costs reprice, the economics of individual nodes and lanes change with them. Networks that can adjust inventory placement and fulfillment around those changes can reduce exposure.
Intermodal Is Quietly Having Its Best Year Ever(5)
Rail Volumes, Trucking Capacity, and the Long-Haul Shift
Intermodal rail is having a breakout year. U.S. intermodal volume set a record for the month of July, the strongest July on record, following a record-setting June. Even so July ranked sixth among all months on record, not just past Julys, since peak-season months typically post the highest volumes overall. That July came in this strong is notable given the July 4th holiday. Through July, intermodal volume is up 3.8% year over year, the strongest year-to-date pace on record. The Association of American Railroads projects 2026 is now on pace to be the strongest year for intermodal in its history.
The strength is notable given tightening trucking economics. DAT reported that June dry-van spot linehaul rates rose 45% year over year while van freight volumes stayed roughly flat. Spot van rates also moved above contract rates for the first time since February 2022. IANA expects capacity constraints in long-haul trucking to keep supporting domestic intermodal growth.
For shippers, this makes intermodal more than an overflow option. As trucking capacity tightens and pricing power returns to carriers, rail becomes more competitive on long-haul lanes where transit requirements allow it, and record volumes suggest that shift is already underway. The bigger obstacle for many shippers is capability, not economics: without rail-served facilities or intermodal expertise, making the switch is hard. Diversifying network nodes and working with experienced intermodal transload partners can provide rail access without requiring a fully rail-served footprint.
July 2026 Regional Market Highlights(6)
Regional Warehousing Detail
Reno, NV: Reno carries the highest vacancy rate in the cohort at 13.4%, though it eased by 0.24 percentage points QoQ. The silver lining for shippers is price: at $9.46/SF, Reno offers West Coast adjacency at a 23% discount to the U.S. average. The Flexe Spot Warehousing Index is tagging Reno as a solid Buyer’s Market.
Savannah, GA: Savannah’s vacancy sits at 12.3%, flat QoQ and the second-highest in the cohort. With Global Port Tracker projecting monthly import declines through December, this availability is unlikely to absorb quickly. Asking rents of $9.37/SF, up 1.0% QoQ, make Savannah the best Buyer’s Market for port-adjacent capacity in the tracked set.
Seattle, WA: Vacancy deteriorated a further 0.52 percentage points QoQ to 10.6%, deepening last quarter’s move into double digits. Rents of $14.56/SF (-1.8% QoQ) remain above the U.S. average, making Seattle one of only two tracked markets holding above-average pricing against double-digit vacancy (Phoenix, at 10.6% and $13.36/SF, is the other). However, the spot market in Seattle is loosening into a Buyer’s Market.
Memphis, TN: Memphis posts the lowest asking rent in the cohort at $5.76/SF (up 0.3% QoQ), 53% below the U.S. average. On 334M SF of inventory, vacancy of 8.3% (-0.24 percentage points QoQ). The nation’s air cargo hub is pricing warehouse space like a tertiary market.
Chicago, IL: The largest industrial market in North America (1.38B SF) carries 5.5% vacancy (up 0.11 percentage points QoQ), two full percentage points below the U.S. average, on rents of $10.35/SF (up 1.9% QoQ). Markets this large usually carry slack, but Chicago’s capacity remains scarce.
Kansas City, MO: Vacancy tightened 0.22 percentage points QoQ to 5.9%, second-lowest among tracked U.S. markets, while rents held at $7.41/SF (flat QoQ). The 34.6% QoQ sublease jump flagged in June appears to be getting absorbed rather than cascading into direct vacancy. As a manufacturing-heavy region, Kansas City’s spot market remains a solid Sellers’s Market.
Toronto, ON: Toronto tightened 0.16 percentage points QoQ to 3.9% vacancy, matching Vancouver and remaining tighter than every U.S. market in the set. Asking rents increased 1.50% QoQ to $13.49/SF, a notable firming for a market this supply-constrained, even as new supply continues to filter through. With such low vacancy, the Flexe Spot Warehousing Index is also pointing to a tightening Seller’s Market in Toronto.
(1) CoStar CRE (2) Logistics Managers’ Index, July 2026; NRF/Hackett Associates Global Port Tracker (3) U.S. Census Bureau, Manufacturing and Trade Inventories and Sales, May 2026; Institute for Supply Management, Manufacturing PMI Report, July 2026; Logistics Managers’ Index, July 2026; NRF/Hackett Associates Global Port Tracker, August 2026; CoStar CRE; Flexe Market Insights Report, July 2026 (4) US Energy Information Administration; Reuters, “Russia’s diesel export ban deepens global supply crunch,” July 11, 2026, Logistics Managers’ Index, July 2026 (5) Lori Ann LaRocco Substack, “U.S. Rail traffic growing at faster rate than GDP,” August 11, 2026; Association of American Railroads, August 2026; DAT Freight & Analytics, July 2026; Intermodal Association of North America, July 2026. (6) CoStar CRE