What Is Warehouse Capacity Planning?
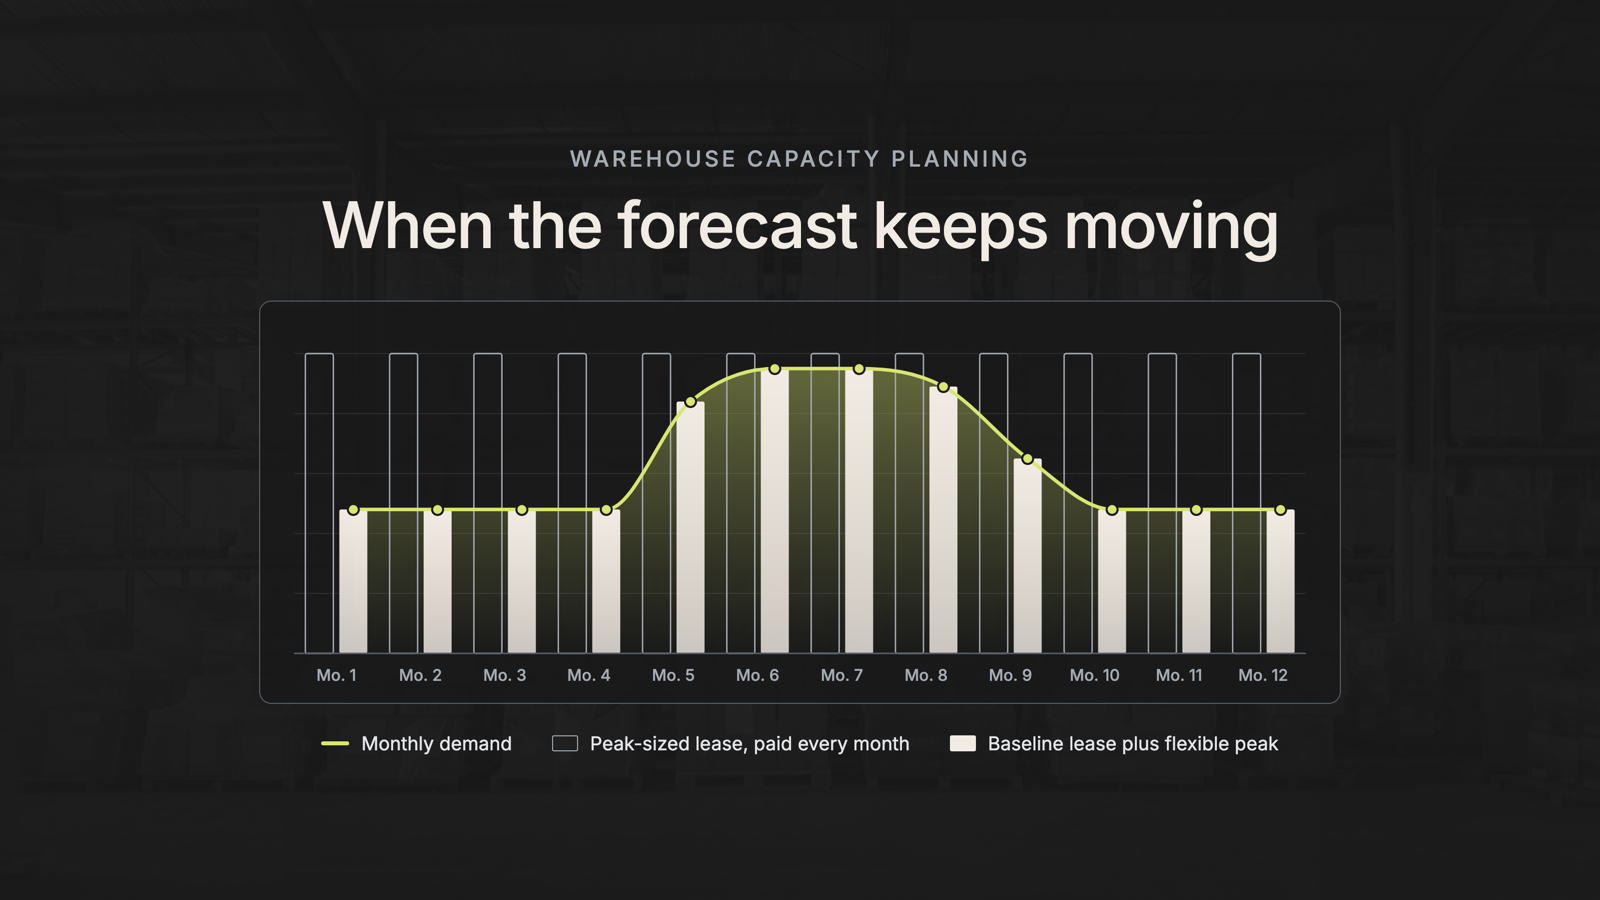
Warehouse capacity planning matches storage positions, labor, and dock throughput to forecast demand, by site and by month. Done well, it plans to a range (low, as forecast, and high) rather than one number. It also decides in advance which capacity is fixed and which can flex. It’s the warehouse side of capacity planning in operations management, applied to a network of buildings rather than one plant.
Capacity is measured in pallet positions and throughput, not square feet. Square footage tells you little until you account for clear height, rack levels, aisles, and docks. Start from positions:
Usable Pallet Positions = Floor Positions × Rack Levels − Positions Lost to Honeycombing and Staging
Floor positions already exclude aisles. The loss term covers partly filled positions, and the floor you hold for staging.
How Demand Planning Feeds Warehouse Capacity Planning
Demand planning tells you how many units you expect to sell. Capacity planning turns those units into pallets and positions at specific sites in specific months. That handoff is where capacity management in the supply chain usually starts.
In many companies, the handoff happens in the monthly sales and operations planning (S&OP) or integrated business planning (IBP) cycle. The demand review sets a consensus forecast, often with low, base, and high scenarios. The supply review then tests that plan against production, inventory, and distribution capacity. That’s usually where a warehouse shortfall first shows up on paper. Finance then turns the plan into budget terms, and the executive review decides whether to spend or accept the risk.
Three things usually get lost between the demand review and the supply review:
- The error range: The demand plan publishes one number, even when everyone knows the band is wide.
- The timing: Inventory arrives before it sells, so peak storage lands weeks ahead of peak sales.
- The location: A national forecast doesn’t say which building fills first.
Good demand and capacity planning carries all three into the supply review: a forecast range, converted into positions by site and by month.
From Units to Square Feet
The conversion is simple arithmetic, and it fits in four spreadsheet columns:
| Step |
Formula |
Hypothetical example |
| Cases |
Units ÷ Units per Case |
1.2 million units ÷ 24 = 50,000 cases |
| Pallets |
Cases ÷ Cases per Pallet |
50,000 ÷ 40 = 1,250 pallets |
| Positions |
Pallets ÷ Target Utilization |
1,250 ÷ 0.85 ≈ 1,471 positions |
| Square feet |
Positions × Square Feet per Position |
1,471 × 10 ≈ 14,700 sq ft |
Hypothetical example. Round pallets up by SKU. The 10 square feet per position is an illustrative figure for a racked building. Your figure depends on rack type, clear height, pallet size, and whether you count the whole building or only the storage zone.
State the density basis whenever you share the result. A storage-zone-only figure and a whole-building figure can differ several times over for the same pallets.
Why Do Warehouse Capacity Forecasts Keep Moving?
Forecasts move because three things change faster than warehouse commitments: demand, trade and tariff policy, and opening dates for new sites. Book capacity to one peak forecast, and you’ll likely land over or under it. You either pay for empty space or scramble for overflow.
Forecast Error Is the Baseline
Even good forecasts miss. In a 2026 survey of 230 supply chain leaders by planning software vendor Blue Ridge, 76% said their forecast accuracy had improved. Most were still at 81–90% accuracy, and only 23% refreshed forecasts continuously.
At 81–90% accuracy, a 10–19% miss on demand is normal. As the peak-layer example above shows, that miss doesn’t spread easily. It lands on the peak. You can work to improve forecast accuracy, and you should. But no process gets the error to zero, so the plan has to absorb what’s left.
Tariffs and Inventory Pull-Forward
Tariff timing has turned inventory into a moving target. In the September 2026 LMI, inventory costs (79.9) ran 21 points above inventory levels (58.9). In the August 2026 LMI, the gap was 25.8 points, nearly double the long-run average of 13.1.
When companies pull inventory forward ahead of a tariff, they need space for months, not years. Then the policy shifts and the inventory curve shifts with it. Our guide to inventory pull-forward strategy in a volatile tariff landscape covers the timing in more depth.
Capacity Takes Longer to Add than Forecasts Stay Right
Site selection alone takes 60–90 days at minimum, and a traditional implementation takes 9 to 18 months. With Flexe, you can go live in under 30 days.
| Path to new capacity |
Phase measured |
Time |
| Traditional site selection |
Site selection only |
60–90 days at minimum |
| Traditional implementation |
Full implementation |
9 to 18 months |
| Flexe |
Go-live |
Under 30 days |
By the time new fixed capacity is live, the forecast that justified it has often been revised, sometimes more than once. That gap is the root of the Fixed-Lease Trap: a multi-year commitment sized on a forecast that won’t hold.
When the New Site Is Late
A new DC that opens three months late leaves inventory with nowhere to go, often during the season it was built for. Treat the opening date as a range. Budget bridge capacity for the late case, with a clear exit once the building is live.
When Capacity Decisions Get Made
Capacity decisions follow the planning calendar, often months before the peak. Timing varies by company and fiscal year, but in many companies it looks like this:
| Planning moment |
Typical timing |
Capacity decision |
| Capital or real estate review |
On the company’s board calendar, often early in the year |
Decide the fixed footprint: build, lease, or hold |
| Peak capacity commitment |
Early summer, for a Q4 peak |
Confirm where the peak layer goes and who supplies it |
| Annual operating plan and budget |
Starts in Q3, presented around October |
Budget the peak layer as an operating cost, separate from the baseline |
| Monthly S&OP supply review |
Weeks 2–3 of each month |
Is the forecast still inside the band? Resize the flexible layer if not |
| Network review |
Every 3–5 years |
Decide where the baseline sites sit and how many you need |
That calendar creates a squeeze. The budget for the next peak is often set while the current one is still running. Flexible capacity is one of the few options you can still commit after the budget locks.
Flexible capacity also changes the approval path. A multi-year lease usually needs a capital or real estate sign-off. A flexible peak layer runs on short terms, so many teams can budget it as an operating cost. When capital is tight, that difference can decide whether the peak gets covered at all.
The calendar also supplies the deadline. Nothing forces a capacity decision until a date does: the budget lock, the peak commitment, a lease renewal, or the next capital review. Put the peak-layer decision on the earliest of those dates.
How to Build a Warehouse Capacity Plan That Survives Forecast Changes
This six-step method assumes the forecast will miss and decides in advance what happens when it does.
- Convert the forecast into pallet positions by site and month.
- Set low, as-forecast, and high bands from your forecast error.
- Lease the baseline you’ll fill all year.
- Put the peak layer on flexible capacity.
- Write add-and-release rules into the planning cycle.
- Plan the exit when you plan the add.
Step 1: Convert the Forecast into Pallet Positions by Site and Month
Every warehouse capacity planning cycle starts with the demand forecast in units. Translate it into pallet positions at the product-family level, using the conversion above. Leave slotting and pick-paths to the warehouse team. Then shift the curve earlier by your inbound lead time, because storage peaks when inventory lands, not when it sells.
The result is the number of positions each site needs each month.
Turn the Same Forecast into Labor Hours
Every pallet that lands also has to be received, put away, and shipped. In many networks, peak labor is harder to add than space. Mike Griffin of Johnson Logistics, an operator in the Flexe Logistics Network, put it simply: “Labor has become incredibly tight.” So convert the forecast into labor hours with the same weekly curve:
Labor Hours = Pallets Handled ÷ Pallets per Labor Hour
Pallets handled is the weekly count received, put away, and shipped. Pallets per labor hour is your crew’s measured rate for that work. Use the heaviest week, not the monthly average, because labor peaks when receiving does.
Take a hypothetical site that receives 1,400 pallets in its heaviest week. At 10 pallets per labor hour, receiving and put-away alone take about 140 hours, or three to four full-time workers.
Flexing the peak layer moves its labor along with its space. At a flexible site, the warehouse operator usually staffs receiving, storage, and shipping. That handling is one of the per-pallet costs in your cushion (see What the Flexible Rate Leaves Out). Pallets you keep in your own buildings still need your crews. Staff permanently for the baseline, and size temporary labor to the peak volume you hold in-house.
Step 2: Set Low, As-Forecast, and High Bands from Your Forecast Error
Measure how far your past forecasts missed at the horizon that matters, usually the time it takes you to add capacity. The standard measure of forecast accuracy is MAPE (mean absolute percentage error), the average size of the miss.
This is scenario planning applied to space. If your six-month MAPE is 15%, your high band is the forecast plus 15% and your low band is the forecast minus 15%. Use your own history, not a benchmark, because forecast error varies widely by category and channel.
MAPE is an average, so some misses will land outside the band. Budget to the MAPE bands and size your contingency plan to your worst historical miss.
Then split each band into the baseline and the peak layer.
| Band |
Total pallets at peak |
Baseline (stable) |
Peak layer |
| Low (−15%) |
44,200 |
40,000 |
4,200 |
| As forecast |
52,000 |
40,000 |
12,000 |
| High (+15%) |
59,800 |
40,000 |
19,800 |
Hypothetical example. The baseline doesn’t move between bands. The whole forecast miss lands on the peak layer.
Step 3: Lease the Baseline You’ll Fill All Year
Size long-term space to the baseline you’d bet on in the low case. To decide which positions earn a lease, run this test.
Lease a position if you’ll fill it more than 12 × (Lease Rate ÷ Flexible Rate) months a year
At the $10 lease rate and the $14.16 Index rate (August 2026), that’s about 8.5 months. The baseline is filled 12 months a year, so it belongs on a lease. The peak layer is filled for four, so it belongs on flexible space. Handling charges, transfer freight, and any storage minimum raise the true flexible cost, so run the test with your all-in rates.
In the as-forecast case, the test splits the network about 77/23: the 40,000 baseline pallets on lease, 12,000 peak pallets on flexible warehousing. That’s close to the planning rule we use, the 80/20 Rule. Lock in about 80% of peak capacity on long-term contracts and run about 20% as a flexible layer. The 80% sits in the long-term sites that carry your baseline. The 20% absorbs seasonal peaks, overflow, and the next surprise.
Step 4: Put the Peak Layer on Flexible Capacity
The layer above the baseline goes to flexible sites close enough to serve the same customers. That means overflow warehouse space on pay-as-you-go terms, so you can manage peak inventory without carrying peak-sized space all year.
Decide three things in the plan, not during the peak.
- Which markets the flexible layer covers
- How much lead time it needs
- Who owns the call
To see which markets have options before any RFP, search the Flexe Warehouse Marketplace against your own requirements. Results are not live availability; a Flexe logistics expert confirms capacity.
Check Availability Before You Count on It
A flexible layer only works if the space is there when the peak arrives. Availability depends on the market, the season, and the type of space. Ambient storage is usually easier to find than temperature-controlled, food-grade, or bonded space.
Markets can tighten quickly. In the September 2026 LMI, warehousing capacity fell from 53.5 to 39.3, deep into contraction. Build availability risk into the plan the same way you build in forecast error:
| Availability risk |
What to write into the plan |
| Your market tightens before peak |
Commit the predictable part of the peak layer at the peak capacity commitment, and leave only the uncertain part open |
| You need specialized space |
Search for it first and give it the longest lead time |
| Your first-choice site falls through |
Name a second market or site within serving distance before you need it |
| The peak runs longer than planned |
Set extension terms when you activate the space, not after |
Flexe’s recommended approach to availability risk in a warehouse capacity plan.
Securing space ahead of a known risk window is the same move. Ace Hardware, for example, positioned emergency supplies near regions forecast for severe weather.
Step 5: Write Add-and-Release Rules into the Planning Cycle
Planning leaders shouldn’t have to watch a building fill up. The plan should decide in advance what happens at each checkpoint. Then the operations team can act on a pre-approved rule instead of escalating an emergency.
Each site has a role in that plan. Long-term sites carry the baseline, and flexible sites absorb the peak layer. The rules below are our recommended approach, not an industry standard.
| Checkpoint |
Who checks |
What to check |
Pre-approved decision |
| Weekly operations review |
Warehouse or operations team |
Long-term site utilization against the trigger level, and labor hours against plan |
Activate flexible space already in the budget |
| Monthly S&OP supply review |
Supply chain planning lead |
Forecast change against the last plan |
Re-run the bands and resize the flexible layer |
| Annual budget |
Supply chain planning lead and finance |
Size and cost of the peak layer |
Budget the flexible layer as an operating cost |
| Lease or contract renewal |
Supply chain planning lead |
Long-term sites well below the ceiling all year |
Resize the fixed footprint |
Flexe’s recommended checkpoints. The utilization ceiling is set from industry guidance.
Industry guidance puts practical warehouse capacity at about 85%. Past that point, congestion slows picking, put-away, and dock work. Our overview of how the Flexe Logistics Network works alongside your long-term warehouses covers the flexible side.
Worked Example: Sizing the Flexible Layer Week by Week
A weekly projection shows how much flexible space the peak needs. For each week, subtract what the site holds at its ceiling from projected pallets:
Overflow = Projected Pallets − (Total Positions × Ceiling), or zero if the result is negative
Take a hypothetical long-term site in the middle of a fast peak build. At 20,000 positions and an 85% ceiling, it holds 17,000 pallets:
| Week |
1 |
2 |
3 |
4 |
5 |
6 |
| Projected pallets |
16,000 |
17,400 |
18,800 |
19,600 |
18,200 |
16,600 |
| Overflow pallets |
0 |
400 |
1,800 |
2,600 |
1,200 |
0 |
Hypothetical example. Effective capacity is 20,000 positions × 85% = 17,000 pallets.
The flexible layer peaks at 2,600 positions in week 4 and totals 6,000 pallet-weeks. Budget the total, not the peak, if your agreement bills by the week or prorates. A lease sized for week 4 would carry those 2,600 positions all year.
Set the trigger early enough to cover the growth that arrives while flexible space activates. Here, volume grows about 1,400 pallets a week. With a two-week lead time, trigger at 14,200 pallets (17,000 − 2,800), or 71% of positions.
Step 6: Plan the Exit When You Plan the Add
Releasing space takes notice, and exit terms vary by agreement. Set the release date and notice window when you activate flexible space, tied to the end of peak. Flexible capacity saves money when you release it as peak ends, not weeks later. When you revisit the plan, check your rate against the monthly Flexe Spot Warehousing Index, not just at lease renewal.
The Math to Bring to Finance
The baseline costs the same either way, so the decision is only about the 12,000 pallets above it. Four numbers answer the questions finance will ask about warehouse capacity planning:
| Finance question |
Answer in the hypothetical model |
Where it comes from |
| What does the peak layer cost each way? |
Flexing costs about $760,000 a year less as forecast, and $1.2M less if the peak comes in low |
Peak-layer table |
| How far would flexible rates have to rise before the answer flips? |
$30 per pallet per month, about 2.1x the August 2026 Index rate and 3x the lease rate |
Break-even on the peak-layer table |
| What does insurance against the high case cost? |
Leasing 59,800 positions (peak plus a 15% reserve) costs $1.70M more than flexing as forecast, every year |
Reserve plan vs. flexible layer |
| How much extra handling and freight can the flexible plan absorb? |
About $63 per extra pallet moved, as forecast or high |
Cushion table |
Hypothetical model. Replace the lease rate, Index rate, and volumes with your own before you present it.
Run the same four numbers with your own volumes, lease rate, and regional rate. Put the result on one page next to the capital request it replaces or shrinks.