North America’s Largest Flexible Warehousing Network
3,000+ warehouses. No leases. Just the space you need.
The pricing benchmark for short-term, on-demand warehousing, updated monthly.
See your estimated savings with pay-as-you-go warehousing.
Instantly find locations and specialized providers to optimize your inventory and handle the unpredictable.
Research, Insights, and Proven Results
Supply chains are constantly adapting to disruptions, changes in consumer demand, and shifting capacity. Here’s the executive summary on what Flexe has been tracking and helping shippers respond to over the past month.
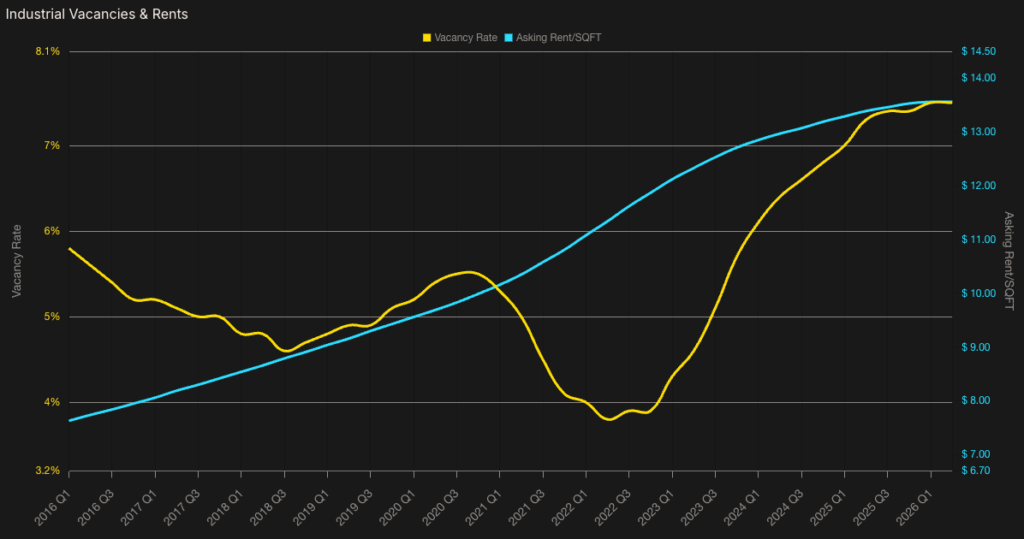
In May, Flexe coined and applied the term Warehousing Stagflation to the state of U.S. and Canada warehousing markets. We see no reason to change that assessment today: Industrial rents dropped, only nominally (0.3%), QoQ in Q2 in the U.S. while availability (sublet + direct) increased 1.0%, continuing a trend of persistently high cost to buyers despite historic-record availability.
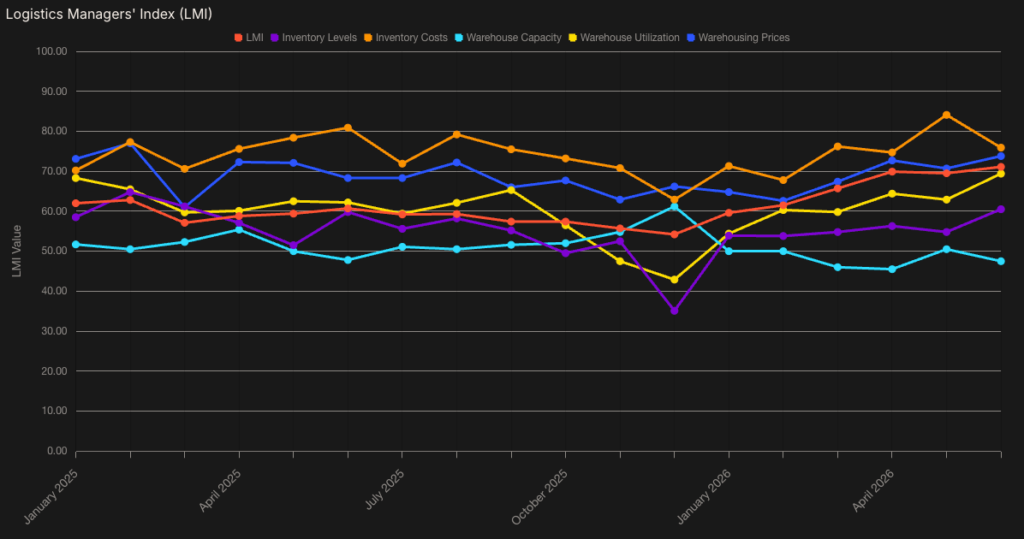
We’d like to show our audience a light at the end of the tunnel. The LMI may be pointing toward a change in warehousing availability, as their June publication cited the highest Warehousing Utilization inflection (69.4) since February 2023, which we cover in more detail below. In pricing, the Flexe Spot Warehousing Index has now shown 3 straight months of increases to short-term pallet storage rates. This indicates that the discount/spread for spot rates vs contract (lease) rates, for purchasing warehouse capacity, is tightening.
At a high level, the state of the US warehousing market can be visualized by tracking two numbers: Industrial Vacancy Rates and Annual Asking Rent per Square Foot, both national averages. These metrics are driven by important, underlying economic variables like trade volumes, retail inventories and sales, and industrial construction and sales, and in turn serve to indicate the overall direction of US warehousing supply & demand.
Summary
Market Dynamics for Fixed Space
Academic researchers in supply chain management build the LMI by surveying logistics leaders monthly on the 8 key measures of supply chain activity shown below. For Warehousing specifically, an industry whose costs for generations have literally been “behind closed doors”, the LMI offers a unique view into capacity, utilization, and ultimately, costs.
Summary
Market Dynamics for Flexible Space
Policy, Imports, and Retail Behavior
For the second year running, peak shipping season has arrived early. NRF and Hackett Associates forecast July 2026 imports at 2.47 million TEU, a new record beating the 2.4 million TEU high from May 2022, as retailers front-load back-to-school and holiday goods ahead of new tariffs expected in August.
That’s not a one-time spike. It’s a pattern. And it changes the math on long-term footprint decisions: committing to fixed capacity means betting on where the peak lands next year, and that bet has now moved twice.
On-demand capacity sidesteps the bet entirely. Positioned near end consumers, it absorbs the wave when it comes and releases when it passes, without anyone needing to forecast the shape of a season that no longer holds still.
LMI, Fuel Costs, and Network Design
Transportation prices hit 96.0 on the LMI in May, the fastest rate of expansion ever recorded for any component of the index. They held at an extreme 92.4 in June. The proximate trigger was the Iran conflict: crude topped $110 a barrel, and national diesel peaked near $5.64 a gallon in early April, above $7 on the West Coast. By late June that shock appeared to have passed. Prices didn’t follow.
The reason is capacity, not fuel. Transportation capacity has now contracted for seven consecutive months, reaching 30.8 in June, while utilization hit an eight-year high. Employment has fallen in four of the last five months, and industry analysts point to elevated operating costs and tightening regulatory pressure on driver availability as what’s limiting carriers’ ability to grow. Compounding the crunch, renewed conflict in the Strait of Hormuz in July has started pushing oil prices back up.
Transportation is now both the largest and fastest-growing line in the logistics cost stack. That makes network geometry the highest-leverage variable a shipper has right now. But freight, warehousing, and duty rates are all repricing on separate clocks, so the optimal node count is a moving target. The real advantage belongs to networks that can re-optimize as inputs shift, not ones built for a cost structure that’s already changed.
Regional Warehousing Detail
Lehigh Valley, PA: Vacancy improved sharply on the quarter, falling 0.88 percentage points QoQ, though it remains elevated at 9.2% and up 1.63 percentage points YoY. Asking rents posted the strongest growth in this cohort at 0.41% QoQ and 5.79% YoY, but sublease availability has ballooned 238.9% YoY as the market works through negative trailing-twelve-month absorption of roughly 1.5M SF.
Indianapolis, IN: Indianapolis posted the strongest recovery in the cohort, with vacancy falling 0.78 percentage points QoQ and 2.95 percentage points YoY to 6.8% on 15.6M SF of trailing-twelve-month absorption against just 3.1M SF of deliveries. Rents accelerated 1.53% QoQ and 2.45% YoY, reinforced by a 46.5% YoY reduction in sublease space.
Kansas City, MO: Vacancy rose 0.28 percentage points QoQ and 0.64 percentage points YoY, though it remains among the tightest in the cohort at 6.1%. Rents were essentially flat at 0.14% QoQ and up 2.49% YoY, while sublease space jumped 34.6% QoQ and 14.2% YoY, a trend worth watching given the market’s otherwise low availability.
Reno, NV: Vacancy climbed another 0.68 percentage points QoQ and 2.75 percentage points YoY to 13.6%, the highest in the cohort, as trailing deliveries of 5.5M SF far exceeded 1.1M SF of absorption. Rents still managed gains of 0.75% QoQ and 2.28% YoY, though a 32.0% YoY surge in sublease availability adds further pressure.
Seattle, WA: Vacancy rose 0.43 percentage points QoQ and 1.50 percentage points YoY, crossing into double digits at 10.1% on negative trailing-twelve-month absorption. Rents maintained modest positive momentum at 0.61% QoQ and 2.63% YoY, and sublease availability contracted sharply, down 18.4% QoQ and 24.2% YoY, while a near-empty pipeline (0.5% of inventory) limits further supply-driven deterioration.
Toronto, CAN: Toronto remains far tighter than any US market in the set at 4.1% vacancy, essentially unchanged QoQ (+0.07 percentage points) and YoY (−0.08 percentage points). Market asking rents were flat, slipping 0.23% QoQ against 0.83% growth YoY to $13.29/SF, while sublease availability expanded 24.2% QoQ and 11.1% YoY as new supply continues to filter through an otherwise supply-constrained market.
(1) CoStar CRE, U.S. Census Bureau (2) FreightWaves, Inc; Logistics Managers’ Index; U.S. Energy Information Administration (3) Maersk North America Market Update — July 2026; National Retail Federation; Jones Lang LaSalle IP, Inc.; Penske Media Corporation (WWD & Women’s Wear Daily) (4) FreightWaves, Inc; The New York Times Company (5) CoStar CRE
For current pricing, vacancy, and demand, nationally and by region, see the Flexe Spot Warehousing Index.
North America’s Largest Flexible Warehousing Network
3,000+ warehouses. No leases. Just the space you need.
The pricing benchmark for short-term, on-demand warehousing, updated monthly.
See your estimated savings with pay-as-you-go warehousing.
Instantly find locations and specialized providers to optimize your inventory and handle the unpredictable.
Research, Insights, and Proven Results
Get new posts delivered to your inbox.