Flexe Discover: Find warehouse capacity, benchmark pricing and prove ROI. Explore Now
Articles

Q2 2025 Warehouse Market Trends

Q2 2025 warehouse market trends: industrial vacancy rose 0.3% YoY, asking rents held flat QoQ, and Flexe network storage rates fell 2.0%.
Q2 2025 Warehouse Market Trends
This report was originally published as the Q2 2025 edition of the Flexe Market Insights report. All figures are as of Q2 2025.

What’s Happening Across the Supply Chain?

Global supply chains are constantly adapting to disruptions, changes in consumer demand, and more. Here’s the executive summary on what Flexe has been tracking and helping shippers to respond to over the past quarter.

US Industrial Leasing Market(1)

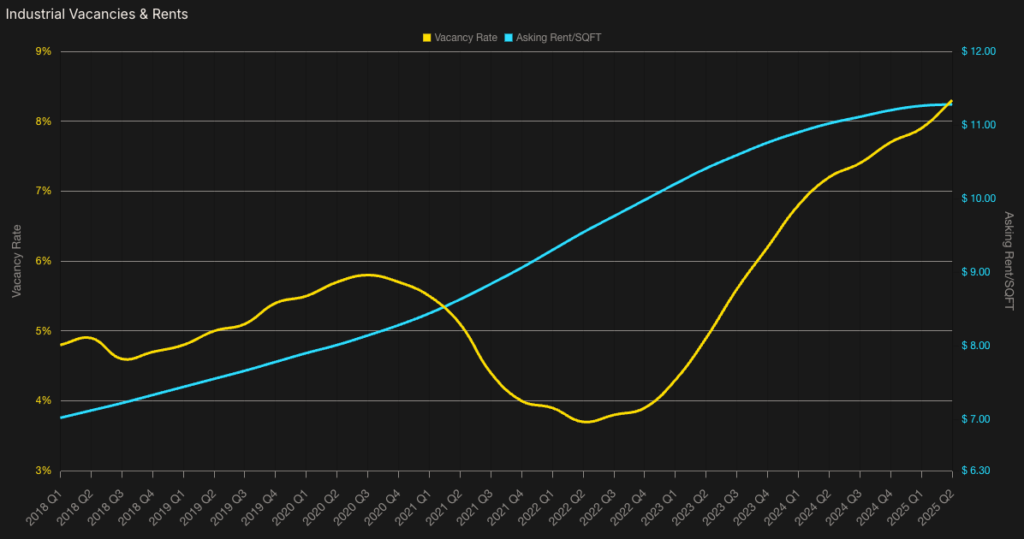
At a high level, the state of the US warehousing market can be visualized by tracking two numbers: Industrial Vacancy Rates and Annual Asking Rent per Square Foot, both national averages. These metrics are driven by important, underlying economic variables like trade volumes, retail inventories and sales, and industrial construction and sales, and in turn serve to indicate the overall direction of US warehousing supply & demand.

Industrial Vacancies & Rents chart, Q2 2025

Industrial Vacancies & Rents

Summary

Market rents stabilizing due to increased vacancies

  • Industrial vacancies rose 0.3% YoY and increased 0.2% QoQ, after three quarters of negligible vacancy rate changes.
  • Asking rents rose 1.4% YoY and <0.01% QoQ. Industrial rents continue to remain stable due to limited leasing activity and limited new deliveries across key markets.
  • New deliveries fell again and are down 51.3% QoQ. Despite this, there was a negative net absorption(2) nationally, signaling continued softness in overall industrial warehouse demand.

Flexe Spot Warehousing Index

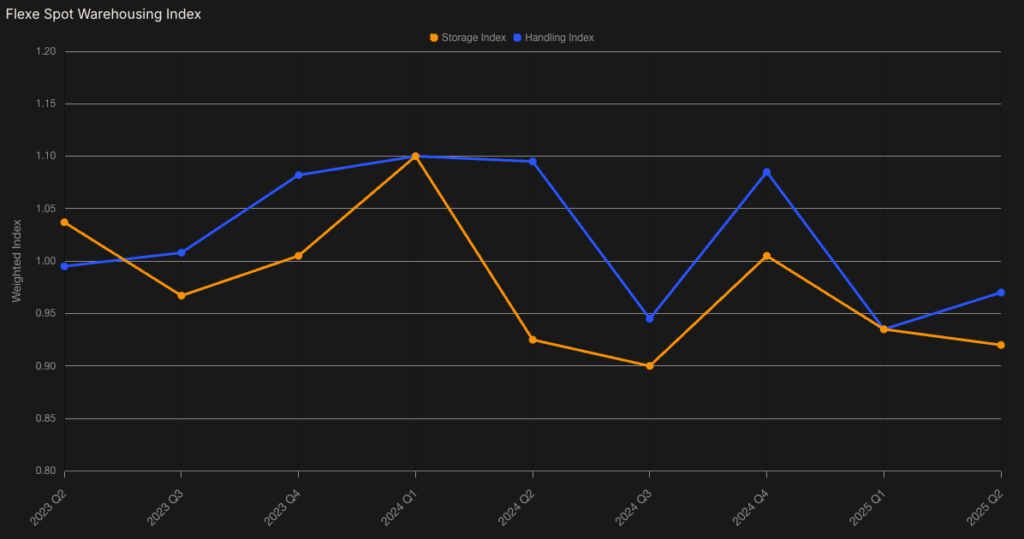
Flexe captures pricing data from its warehouse network multiple times per day. While traditional, industrial real estate indices track the base costs for fixed assets (e.g. a long-term lease), the Flexe Spot Warehousing Index tracks real quotes provided and contracted for warehousing services. This index represents how Flexe’s marketplace responds dynamically to changes in 3PL availability and demand, for handling services, as well as storage.

Flexe Spot Warehousing Index chart, Q2 2025

Summary

Against a backdrop of increasing but stabilizing lease rates, transactional storage and handling rates for 3PL services are fluctuating with traditional seasonal peaks and disruption events, and generally in the direction of lower prices to shippers.

  • Following a sharp rise in transactional storage and handling rates in 2024 Q4, storage rates fell 2.0% QoQ in 2025 Q2 across the Flexe network.
  • Rates for handling increased 3.2% QoQ after a sharp decrease in 2025 Q1.
  • Throughout Q2 2025, Flexe observed highly aggressive pricing behavior from its warehouse operators due to increased availability.

Logistics Managers’ Index (LMI)(3)

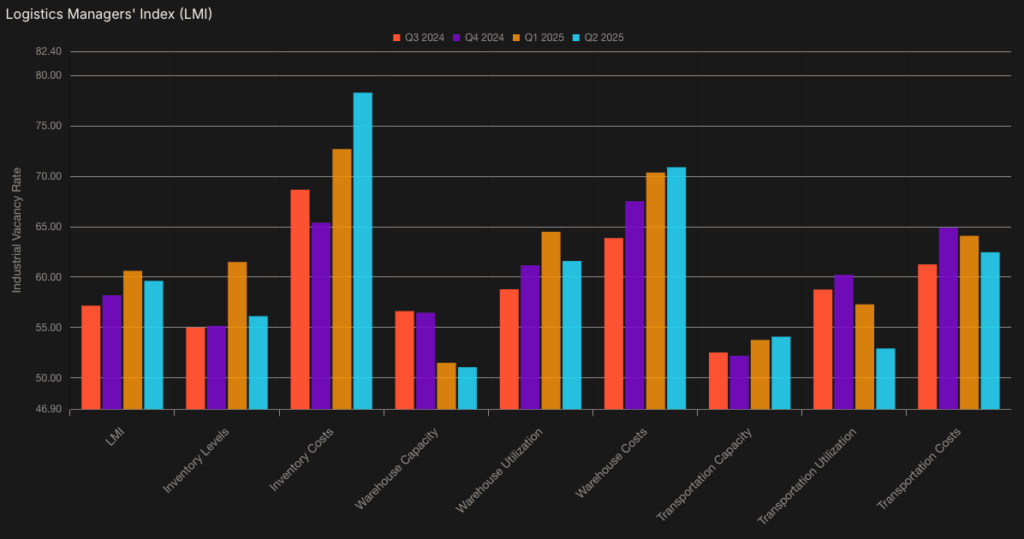
Academic researchers in supply chain management build the LMI by surveying logistics leaders monthly on the 8 key measures of supply chain activity shown below. For Warehousing specifically, an industry whose costs for generations have literally been “behind closed doors”, the LMI offers a unique view into capacity, utilization, and ultimately, costs.

Logistics Managers' Index (LMI) chart, Q2 2025

Summary

Market rents stabilizing due to increased vacancies

  • Since Q4 2023, the logistics industry, per the LMI, has continued to expand. In Q2 2025, it expanded at a rate slightly slower than in Q1 2025.
  • Despite continued growth throughout 2025 across the industry, uncertainty exists due to high costs of inventory and continued uncertainty regarding US trade policy.
  • Warehouse capacity neared contraction in Q2 2025, which hasn’t occurred since Q1 2023, due to continued growth in warehouse utilization. Likely driven by more shippers choosing to forward-stock inventories.

International Trade

Uncertainty Abounds

An already confused tariff and trade picture for shippers became even more so with the August 29 finding by the Court of Appeals for the Federal Circuit that the administration’s use of International Emergency Economic Powers Act to enact tariffs was illegal. There is forward-looking uncertainty focused on the Supreme Court’s scheduling hearing on the case in the first week of November. And, now, there is backward-looking uncertainty that a ruling in line with the Court of Appeals would reverse the effect of previously collected tariffs, setting up an administrative debacle for those in international supply chains to begin applying for duty drawbacks on 6+ months of imports.

The current cases do NOT directly impact additional tariffs enacted by the administration applied to specific materials, and based on other legislation (e.g. Section 301 tariffs)

Last-Mile & Parcel

New, Growing Players fighting with Legacy over market share

Amazon recently announced that their final-mile services are now available to sellers on marketplaces competing directly with Amazon’s own marketplace, most notably Walmart. OnTrac recently announced a Q1 ’26 rollout of expanded national services at the express (2-3 day) and economy (slower, less definite than traditional ‘ground’). Veho launched in California.

All of this comes against a backdrop of the elimination of the so-called ‘de minimis’ loophole (combined with higher tariffs), and Amazon shifting volumes from UPS to FedEx, while those two legacy players regularly announce new or increased surcharges.

The overall picture looks like more competition in a space projecting lower growth than initially following Covid, ultimately benefitting shippers looking to diversify, but demanding a more complex last-mile orchestration solution.

Labor & Interest Rates

A mixed labor market picture spurs the Fed to action

The first rate cut in 2025 was precipitated by a weak jobs report and signals of slower hiring. Overall economic uncertainty, highlighted by trade uncertainty, has been cited as a top cause for the jobs slowdown. And given nothing rosier in the outlook, the Fed indicated it is probable that more cuts are expected in 2025.

Interestingly, ‘Transportation & Warehousing’ was a relative bright spot, with this employment category adding 3.8, 6.3, and 3.6M jobs over the last 3 months.

A declining interest rate environment, combined with changes to IRS depreciation rules, are key drivers in the administration’s strategy to drive more investment in domestic manufacturing (& inventories).

(1) CoStar CRE (2) Net absorption measures the net change in occupied space within a specific market and timeframe, calculated by subtracting the amount of space vacated from the amount of space leased (3) Logistics Managers’ Index

For current pricing, vacancy, and demand, nationally and by region, see the Flexe Spot Warehousing Index.

Article

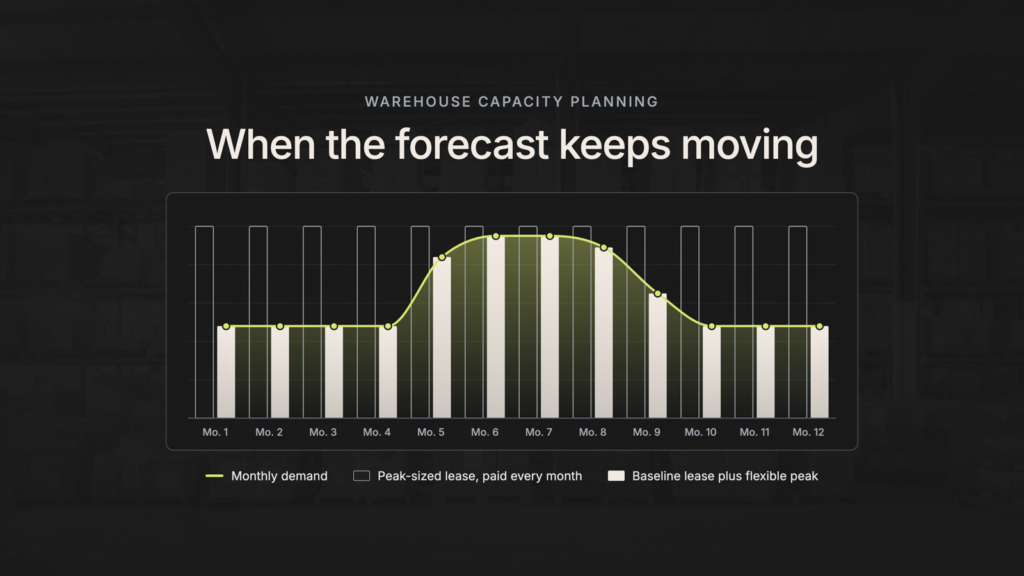
Warehouse Capacity Planning When the Forecast Keeps Moving

Warehouse Capacity Planning When the Forecast Keeps Moving

Warehouse Solutions

Transform your supply chain with an asset-light, agile approach

Discover

North America’s Largest Flexible Warehousing Network

Find Flexible Rates, Space, and Terms.

Instantly find locations and specialized providers to optimize your inventory and handle the unpredictable.

How It Works

A Dynamic Business Needs a Dynamic Supply Chain

Resources

Research, Insights, and Proven Results

Who We Are

Subscribe to
Flexe Resources

Get new posts delivered to your inbox.

Sign up to be part of the Flexe Logistics Network. Flexe Resources