Flexe Discover: Find warehouse capacity, benchmark pricing and prove ROI. Explore Now
Articles

Q4 2025 Warehouse Market Trends

Q4 2025 warehouse market trends: vacancy held at 8.3% after 13 straight quarterly rises, sublets topped 93M sq ft, and rents ticked up.
Q4 2025 Warehouse Market Trends
This report was originally published as the Q4 2025 edition of the Flexe Market Insights report. All figures are as of Q4 2025.

What’s Happening Across the Supply Chain?

Global supply chains are constantly adapting to disruptions, changes in consumer demand, and more. Here’s the executive summary on what Flexe has been tracking and helping shippers respond to over the past quarter.

US Industrial Leasing Market(1)

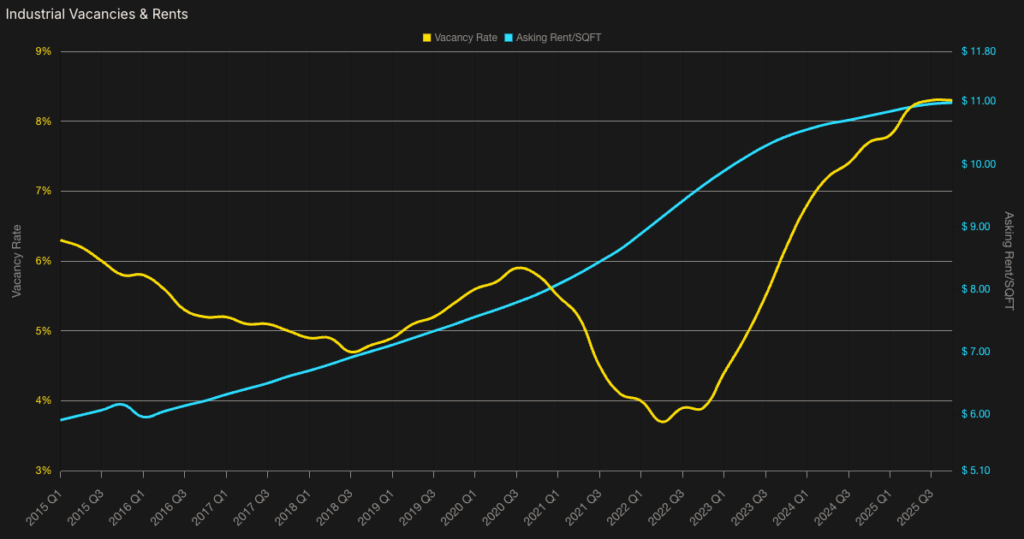
At a high level, the state of the US warehousing market can be visualized by tracking two numbers: Industrial Vacancy Rates and Annual Asking Rent per Square Foot, both national averages. These metrics are driven by important, underlying economic variables like trade volumes, retail inventories and sales, and industrial construction and sales, and in turn serve to indicate the overall direction of US warehousing supply & demand.

Industrial Vacancies & Rents chart, Q4 2025

Industrial Vacancies & Rents

Summary

Market Dynamics for Fixed Space

  • After an historic 13 consecutive quarters of increases in warehouse vacancy, hitting a low in Q2 of 2022 at 3.7%, Q4 of 2025 broke the streak and came in at the same level as the prior quarter: 8.3%. Could this be the light at the end of a long tunnel for property developers and industrial real estate brokers, as they continue to keep close tabs on volume of new deliveries and net absorption of warehousing stock?
  • A prime indicator that the supply glut is not past, and potentially even understated, is the similarly unprecedented inventory of sublet warehousing. This stood at over 93M sq ft to end 2025.
    • Available sublets, year-end 2022: 21M sqft
    • Available sublets, year-end 2023: 67M sqft
    • Available sublets, year-end 2024: 88M sqft

    Though the growth rate is showing signs of slowing, this is reported to be only a fraction of the overall “underutilized” leased warehouse space nationwide.

  • And rents continue to defy gravity. Despite this demand-supply imbalance, national warehouse asking rents ticked up another $0.02 in Q4 2025. There are inflationary pressures, certainly, and this rate of increase is likely to be net negative in real terms. However, given clear over-supply in this market, it’s reasonable to speculate as to when buyers are going to see a “buyers’ market” to capitalize on the glut of 968,000,000+ sqft in vacant warehouse footprint to start 2026.

Logistics Managers’ Index (LMI)(2)

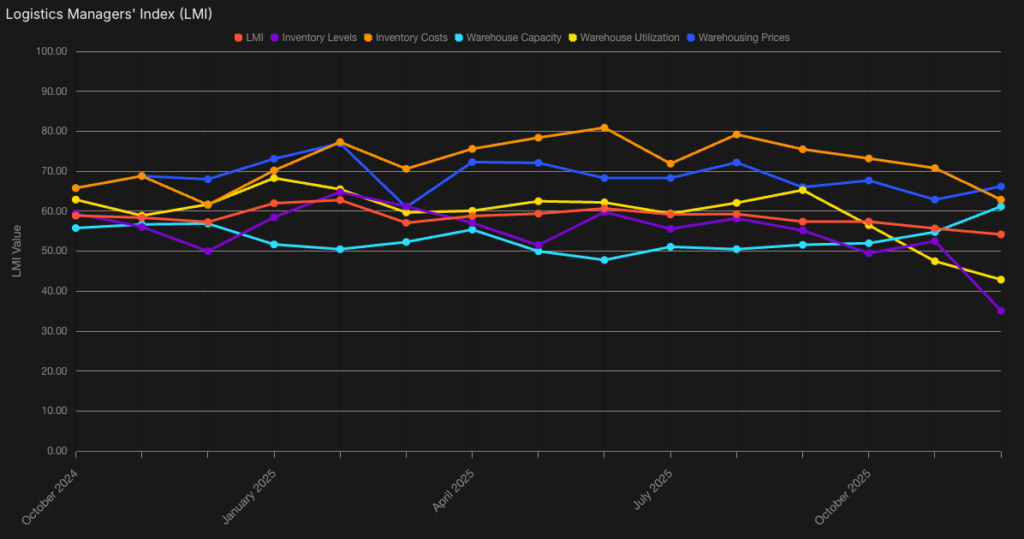
Academic researchers in supply chain management build the LMI by surveying logistics leaders monthly on the 8 key measures of supply chain activity shown below. For Warehousing specifically, an industry whose costs for generations have literally been “behind closed doors”, the LMI offers a unique view into capacity, utilization, and ultimately, costs.

Logistics Managers' Index (LMI) chart, Q4 2025

Summary

Market Dynamics for Flexible Space

  • Inventory Draw-Down: Inventory levels hit a record low 35.1 as firms pushed goods to consumers while import and manufacturing volumes lagged. This “lean” strategy is expected to last through 2026, sustaining a buyer’s market for shippers and 3PLs looking to expand or renegotiate leases.
  • Abundant Capacity, Low Utilization: In December 2025, warehouse capacity rose to 61.2 while utilization plummeted to an all-time low of 42.9. With over 93M sq. ft. of sublet volume available, shippers and 3PLs are aggressively seeking to exit underutilized, long-term commitments. Creating more options for buyers.
  • Price Resilience: Despite record-low utilization, warehouse prices remain high 66.2 and are forecasted to climb 72.1 in 2026. This disconnect, driven by labor and input inflation, suggests significant cost savings are available in the short-term market compared to expensive long-term leases.

The Macroeconomic Environment(3)

Return of ‘Resilience’ in Supply Chains

In 2025, turbulent consumer sentiment coupled with a volatile tariff landscape created uncertainty for both shippers and consumers. With an effective tariff rate climbing to 16.8% – the highest level since 1935 – shippers and consumers are navigating an unprecedented macroeconomic climate where import costs have become a primary driver of persistent inflation. These conditions have forced shippers to re-assess supply chain partnerships. One example specific to warehousing, is a marked shift away from rigid, long-term leases toward agile, localized networks. To combat rising prices and purchasing power erosion, Flexe customers are utilizing on demand scalability and shared warehouses to manage inventory surges without the financial burden of multi-year agreements in, what could become, underutilized facilities.

This new era of hyper-responsiveness is partly a direct result of the click to door expectations of a value conscious public as nearly 59% of companies now prioritize same day or next day delivery. The utilization of modern warehouses plus flexible terms allows firms to protect their margins against unpredictable demand spikes while maintaining the speed and reliability expected by customers in 2026.

Data Center Construction(4)

Logistics Support Strategies

The data center real estate market is experiencing explosive growth, anticipated to reach $902 billion by 2033 and is being driven by the rapid adoption of AI, cloud computing, and 5G. As firms race to build the infrastructure needed for rapid expansion, they face significant logistical hurdles from managing complex, high-cost facility builds to multi-tiered supply chain bottlenecks. Flexible warehousing has proven to be a strategic lever for firms constructing or supplying manufacturing sites, and is now being utilized to support this new high-growth industrial real estate sector.

Rapid Scalability: the Flexe platform, enabled by the Flexe logistics network allows firms to activate temporary distribution & pooling points in a matter of weeks. This agility is essential for supporting projects requiring site equipment to be delivered in precise sequence, though equipment itself may be landing weeks or months earlier, without being locked into permanent infrastructure.

Capital Efficiency: Unlike traditional long-term leases, flexible warehousing utilizes transactional pricing and short-term contracts allowing firms to pay only for the storage they use during the active construction phase, preserving capital for other high stakes project needs.

Reduced construction delays: Using Flexe’s Warehouse Management System (WMS) companies can streamline the flow of goods to the job site, ensuring that specialized trades have the materials they need precisely when they are scheduled to work.

2025 Regional Market Highlights

Regional Warehousing Detail

In 2025, the US industrial real estate market experienced positive net absorption in markets dominated by modern, high-quality warehouses and negative net absorption for older facilities. Overall, national net absorption was positive, totaling approximately 176.8 million square feet, though demand was concentrated in specific high-growth logistics hubs.

Atlanta: Signs of Stabilization: After facing high supply-side pressure, Atlanta’s vacancy rate showed its first quarterly compression in years, dipping from a peak of 9.8% in Q3 to 9.6% by year-end 2025. Net absorption rebounded into positive territory with 1.9 million SF in Q4, driven by a “flight to quality” in newer, automation-ready facilities.

Chicago: Resilient Industrial Backbone: Chicago outperformed national peers with a remarkably stable vacancy rate of 5.5% to 5.9%. The market recorded robust net absorption of 4.9 million SF in Q4 alone, supported by its critical intermodal infrastructure and a surge in demand for mid-sized facilities (200k–600k SF).

Los Angeles: Coastal Recalibration: The L.A. market experienced a transitional year, ending 2025 with 3 million SF of positive net absorption—the first positive annual total since 2022. However, vacancy rose to 7.0% by Q4 due to large tenant move-outs and ongoing trade policy uncertainty at the Port of Los Angeles.

Dallas-Fort Worth (DFW): Heavyweight Performance: Despite an elevated vacancy rate of 9.1%, DFW continued to lead the nation in demand, with roughly two square feet occupied for every one vacated in late 2025. E-commerce and manufacturing remained the primary drivers, with a massive leasing pipeline projected to reach 70 million SF by the end of the year.

(1) CoStar CRE (2) Logistics Managers’ Index (3) Capital One Shopping, The Budget Lab at Yale (4) Grand View Research

For current pricing, vacancy, and demand, nationally and by region, see the Flexe Spot Warehousing Index.

Article

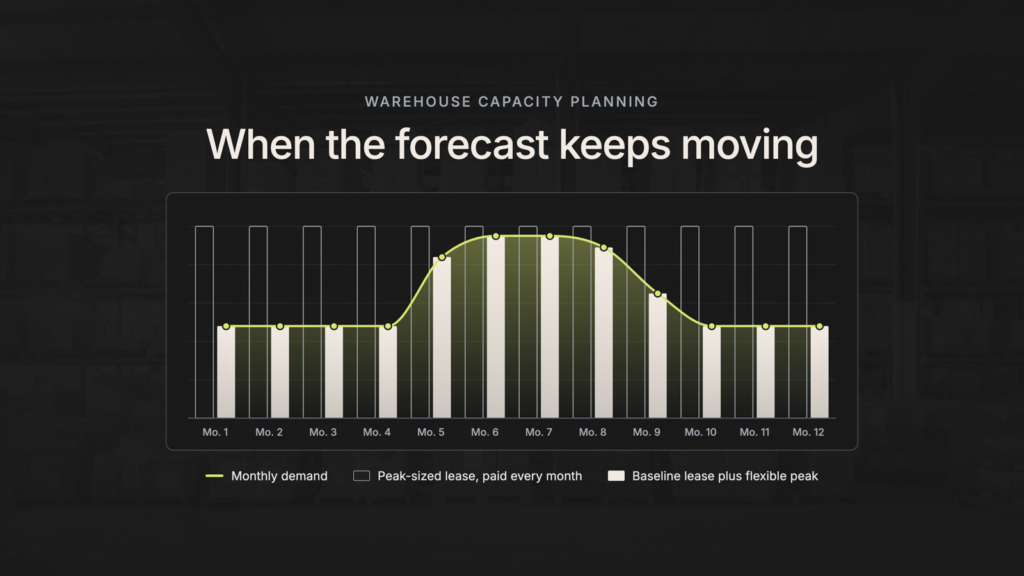
Warehouse Capacity Planning When the Forecast Keeps Moving

Warehouse Capacity Planning When the Forecast Keeps Moving

Warehouse Solutions

Transform your supply chain with an asset-light, agile approach

Discover

North America’s Largest Flexible Warehousing Network

Find Flexible Rates, Space, and Terms.

Instantly find locations and specialized providers to optimize your inventory and handle the unpredictable.

How It Works

A Dynamic Business Needs a Dynamic Supply Chain

Resources

Research, Insights, and Proven Results

Who We Are

Subscribe to
Flexe Resources

Get new posts delivered to your inbox.

Sign up to be part of the Flexe Logistics Network. Flexe Resources