Why Is Traditional Warehouse Site Selection No Longer Enough?
Legacy site selection had one move: find a building and commit. In a stable market, that was fine. In this one, it’s a liability.
Today, demand shifts. Customer locations change. Seasonal cycles move inventory requirements across regions quarter by quarter. Strategic Network Optimization means placing inventory based on where distribution demand actually lives, regularly updated by market data, not driven by what leases happen to be available.
To stay competitive, logistics managers need to think beyond the “four walls” of a single facility and build networks that flex with their distribution requirements.
What Are the Three Pillars of Warehouse Location Strategy for Distribution Networks?
Effective site selection relies on balancing three distinct factors.
- Proximity to Distribution Points (Outbound Reach): Placing inventory closer to the customers, facilities, and distribution points you serve most frequently — dramatically reducing outbound transportation costs, which are typically the largest line item in any distribution budget. For omnichannel operators, this means positioning inventory to serve both network replenishment and direct customer delivery from the same node where possible.
- Market Liquidity: A measure of how easily you can add or shed warehouse space in a specific region. High-liquidity markets enable the “agility layer” of your network to function. What is an agility layer? It’s the portion of your network, roughly 20% of inventory, held in flexible, short-term locations designed to absorb distribution surges (seasonal promotions, demand spikes, supply chain disruptions) without long-term lease commitments.
- Arbitrage Opportunities: Finding high-vacancy “cool zones” (markets with available space and below-average rates) to offset the cost premium of essential “hot zones” (tight, high-demand markets where proximity to your key distribution points makes presence non-negotiable).
How Do You Build a Warehouse Site Selection Strategy for Distribution?
Step 1: Map Your Distribution Demand Before Selecting Sites
Before evaluating any market, map where your outbound volume actually goes. The goal is the same regardless of industry: identify the geographic clusters where your distribution demand is concentrated. Those clusters define where your anchor nodes need to be, not the other way around.
Step 2: Identify “Anchor” vs. “Agility” Nodes
Stop sizing your entire network for your busiest distribution week of the year. Apply the 80/20 Rule instead:
- Anchor Nodes: Long-term, stable locations sized for your 80% baseline distribution volume. These sit inside or adjacent to your primary customer and delivery point density zones, moderate cost, reliable throughput, consistent service levels.
- Agility Nodes: Flexible, short-term locations for the remaining 20%, seasonal inventory builds, promotional overstock, distribution to secondary locations or reaction to disruptions. Use the Spot Warehousing Index* to identify where agility space is available before distribution demand peaks.
*The Spot Warehousing Index is a proprietary, data-driven benchmark for on-demand storage pricing that scores warehouse markets by vacancy rate, pricing trends, and demand pressure, helping logistics teams identify where flexible space is available and affordable before rates shift.
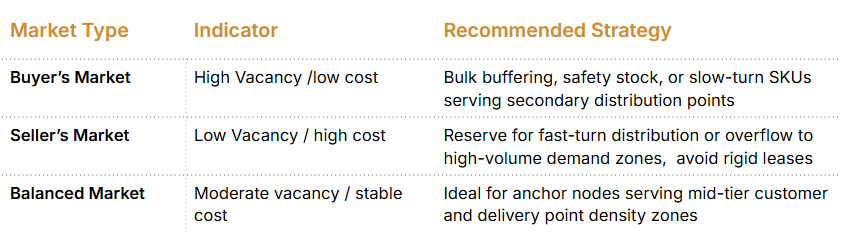
Step 3: Match Vacancy Rates to Your Inventory and Distribution Strategy
Avoid inflexible leases in typically high-cost hubs like the Inland Empire (CA) or Northern New Jersey unless your customer density in those markets justifies the premium, rate leverage is minimal.
Step 4: Evaluate Cost to Serve — Not Just Storage Rate
“Cheap space” is not always “cheap distribution.” The real measure is cost to serve, what it actually costs to get inventory from a given location to your customers or delivery points. A directional starting point:
Cost to Serve = (Storage Rate + Inbound Freight) − Outbound Freight Differential
Where outbound freight differential is the difference between what you’d pay shipping from your current location vs. the proposed location to the same delivery points.
A complete cost-to-serve model also factors in labor and handling fees, drayage and accessorial charges, and inventory carrying costs. The core insight holds regardless: a facility that costs less per pallet to store but sits 300 miles further from your primary demand zone will almost always cost more to actually serve your network from.
What Warehouse Market “Persona” Fits Your Distribution Network?
Not every warehouse node serves the same distribution purpose. Use current Spot Warehousing Index data to categorize your locations:
The Pressure Valve
- Market signal: Decreasing Index score / high vacancy
- Best for: Moving overflow here to relieve pressure on your primary hubs.
The Strategic Beachhead
- Market signal: Increasing Index / rising demand
- Best for: Securing flexible space now before rates peak in that region.
The Efficiency Engine
- Market signal: Stable Index / moderate cost
- Best for: Use as a permanent secondary node to reduce transit times.
How Do You Audit Your Distribution Network for Hidden Risk?
Run this quarterly network audit to identify gaps before they become distribution problems:
- Concentration Risk: Is more than 50% of my inventory in a high-cost, low-vacancy market? If yes, you have no exit when rates spike and limited flexibility to shift distribution flows.
- Outbound Reach Audit: What is the average distance from my warehouse locations to my top 20% of customers and delivery points by volume? Every unnecessary mile in your distribution lanes is direct margin erosion.
- Flexibility Ratio: If demand dropped 15% tomorrow, how much space would I be paying for with no inventory in it (“dead air”)? This is your locked-in cost exposure.
- Distribution Lane Coverage: Are all of my primary customer and delivery point density zones within an acceptable transit window from at least one network node? Coverage gaps create service failures and expedite costs.
- Lease Expiration Mapping: Do any long-term leases expire during your peak distribution season? Renewal leverage disappears at exactly the wrong time.
Real-World Example: How One Company Cut Storage Costs 14% by Repositioning Slow-Turn Inventory
The Challenge: A national distributor was paying a 22% market premium for a fixed lease in Northern New Jersey, typically one of the most expensive warehouse markets in the U.S. to store a mix of fast- and slow-moving inventory serving their East Coast distribution network.
The Play: Based on Market Insights data showing elevated vacancy in Eastern Pennsylvania, they relocated 1,000 pallets of slow-moving, low-velocity inventory to a flexible site in that market, a classic “cool zone” move. Fast-turn inventory stayed in NJ, close to the high-velocity demand zone it served.
The Result:
- 14% reduction in total storage costs
- Significant reduction in “dead air” expenses during the post-peak inventory dip
- No degradation in distribution service levels, Eastern PA serves the same East Coast footprint with comparable transit times
The Lesson: Not all inventory has the same proximity requirement. Slow-moving or buffer stock doesn’t need to occupy premium distribution nodes. Segmenting by velocity, and locating accordingly, is where the savings are.
Frequently Asked Questions